


Wil jij de kansen van AI optimaal benutten? De experts van ai.nl helpen.


De AI transformatie biedt onbegrensde mogelijkheden voor jouw team en organisatie. Met de experts van ai.nl maak je meer impact in minder tijd.


Met de juiste AI tools kan jouw organisatie tot 33% efficiënter werken
Groei binnen bedrijven die
investeren in AI (Gartner)
Van de banen zullen
veranderen (IBM/MIT)
Onze diensten
Voor iedere business uitdaging
is er een AI-oplossing
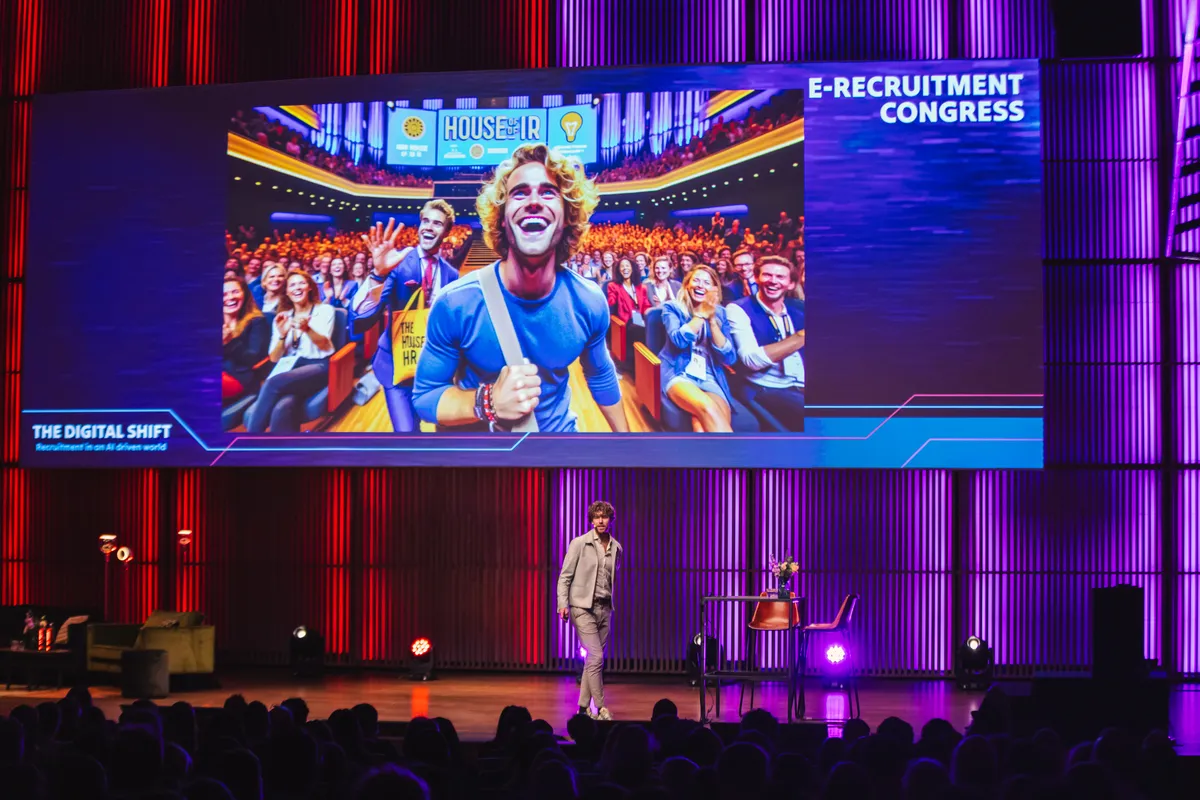
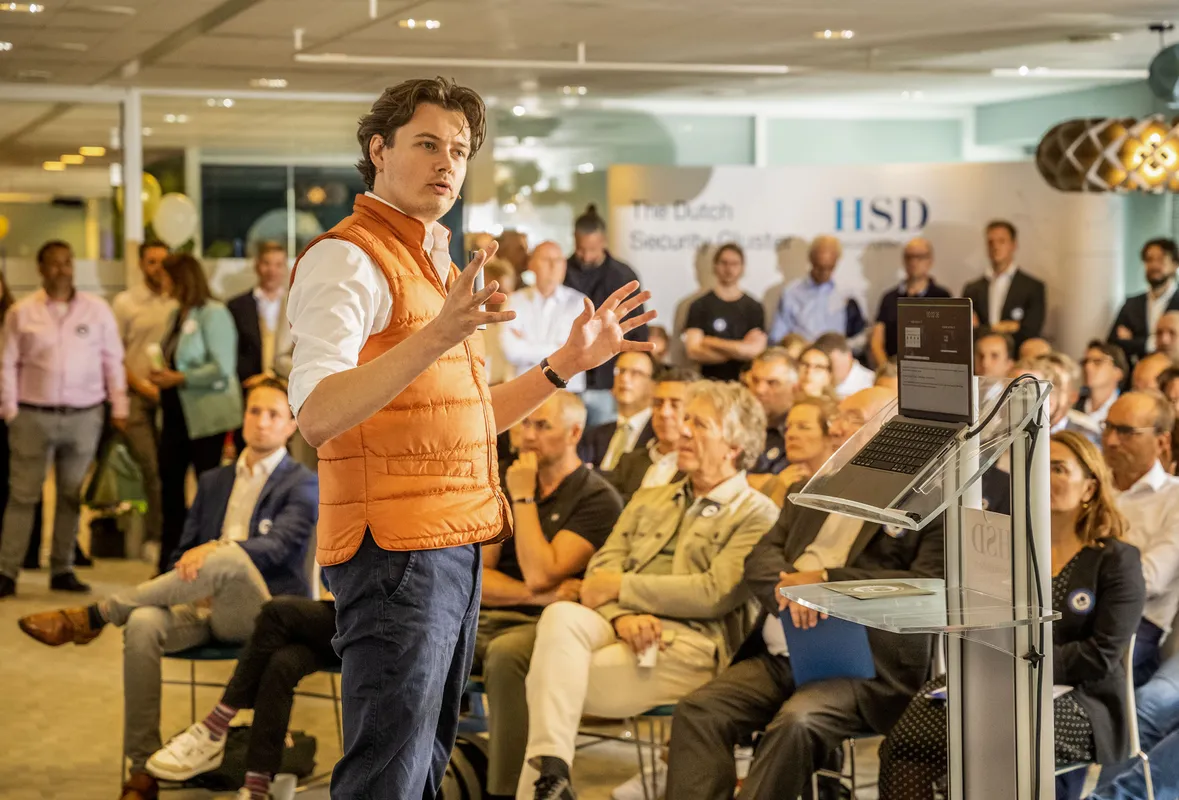
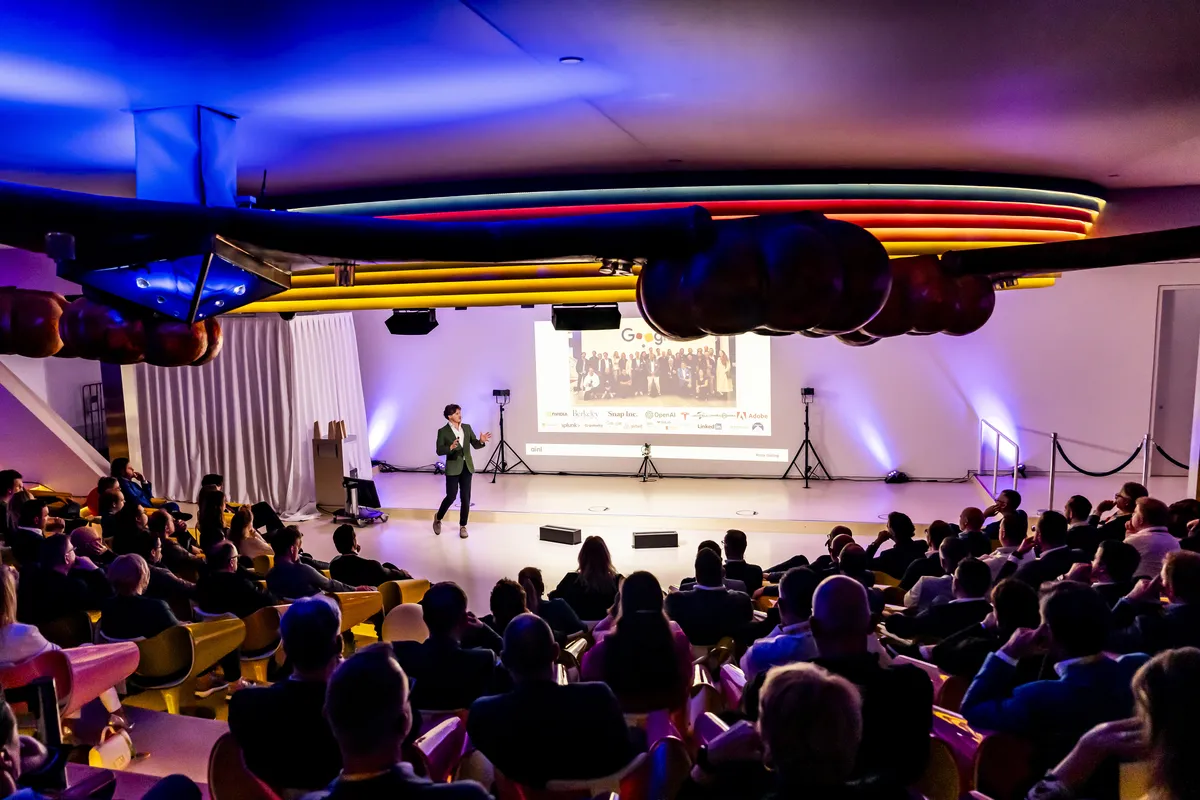
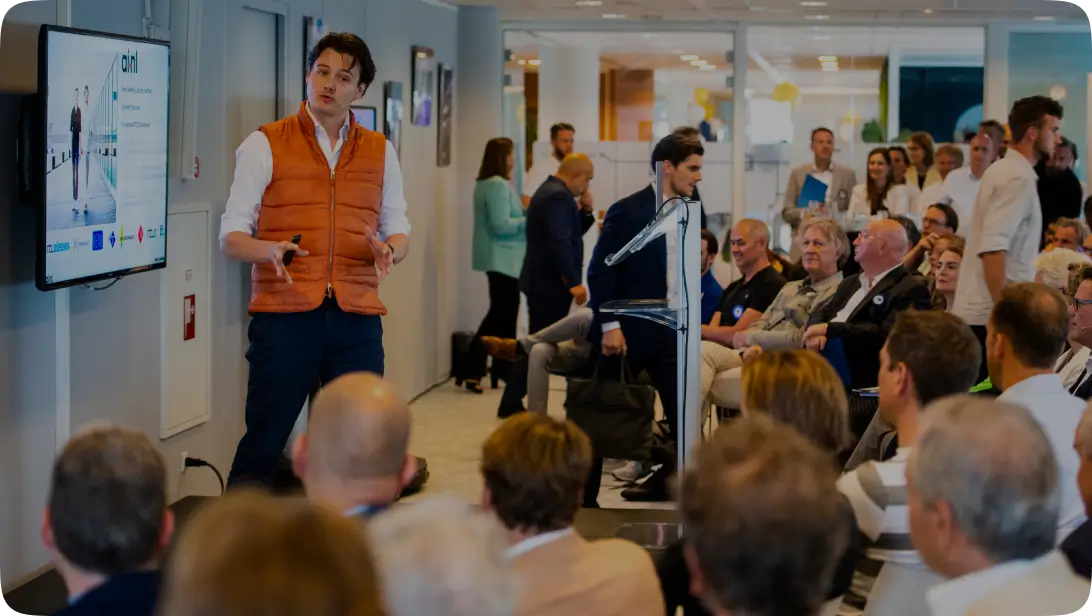
AI Keynotes
Onze AI keynotes geven jouw medewerkers en klanten een inspirerende deep-dive in de ontwikkelingen rondom AI. Ruim 120 per jaar, gemiddeld met een 8.6 beoordeeld.

AI Workshops
In onze praktische AI workshops leren we professionals hoe ze concreet AI-tools zoals ChatGPT en Microsoft CoPilot in de praktijk kunnen toepassen. Van finance tot HR en van inkoop tot backoffice.

AI Consultancy
Wil jij je gehele organisatie transformeren met de mogelijkheden van data en (generatieve) AI. We staan voor je klaar. Programma's variërend van 4 uur tot 4 weken.

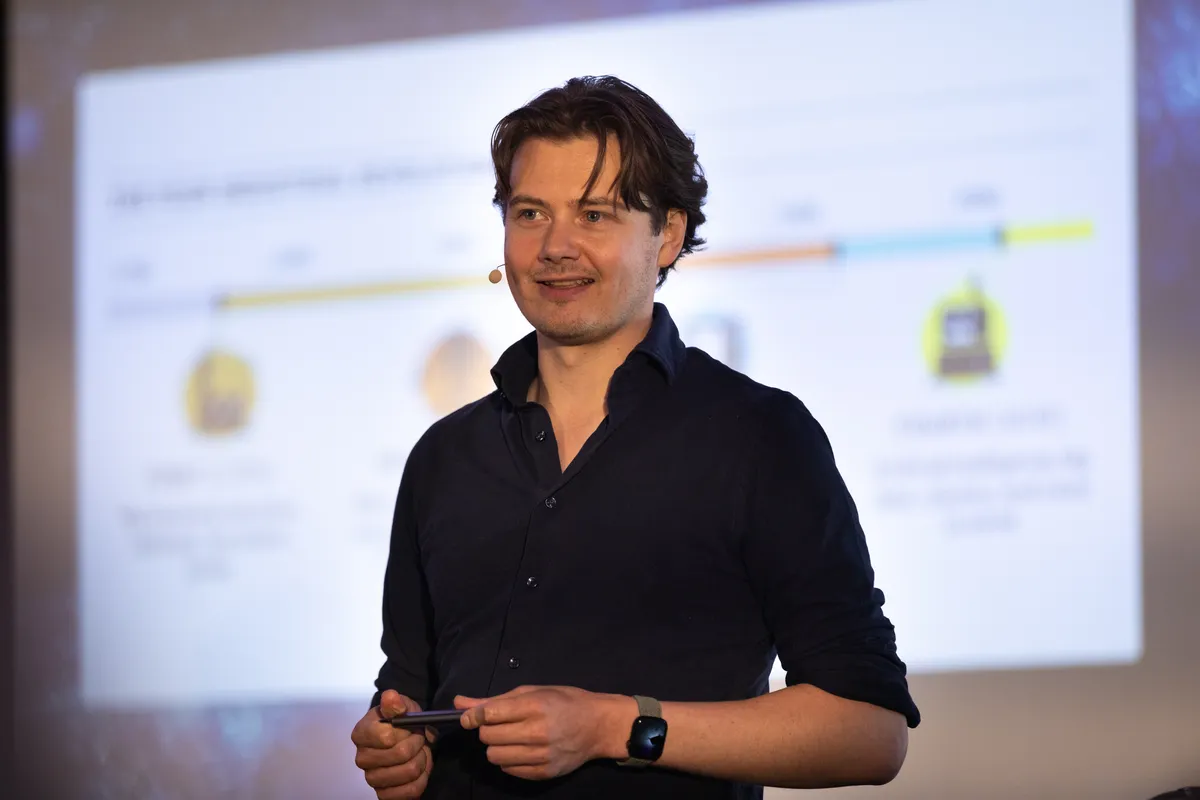
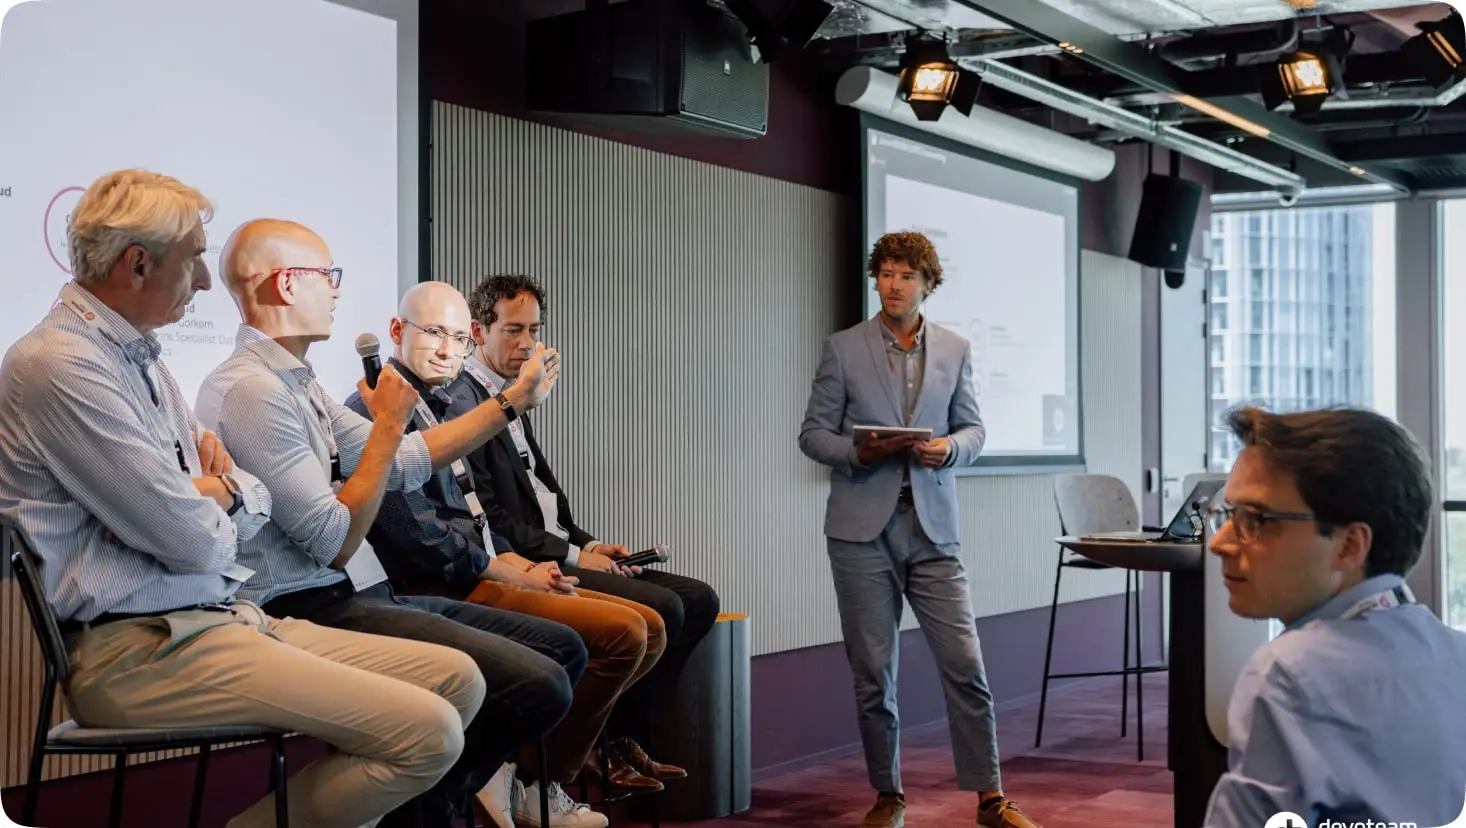
Zo helpen wij jouw organisatie te versnellen met AI
Als het gaat om een inspirerende keynote, een praktische workshop of een verdiepende consultancy-sessie, onze experts staan voor je klaar.


Ai.nl heeft 50+ bedrijven geholpen met AI vraagstuken


Wat klanten zeggen
Het team van ai.nl geeft op een toegankelijke manier verdieping over AI. De presentatie is <span class="is-dark-blue-span">interactief en beeldend</span>. Iedereen binnen ons team had na deze sessie belangrijke basiskennis van AI en hoe het ons kan helpen onze processen makkelijker te maken.


Hoe kun je AI en ChatGPT als organisatie omarmen, wat betekent dit voor de strategie? In een <span class="is-dark-blue-span">power sessie</span> van 60 minuten nam ai.nl ons mee in deze vragen, de impact van AI op de samenleving en wat er nog op ons af gaat komen.


Het team van ai.nl heeft ons op inspirerende wijze meegenomen in de wondere wereld van AI. Ze <span class="is-dark-blue-span">spraken boeiend</span> en de presentatie was goed gestructureerd en informatief. Ze slaagde erin om een complex onderwerp als AI en ChatGPT op een begrijpelijke manier uit te leggen, zodat iedereen s het kon begrijpen.


De presentatie over AI-trends en de toekomst van werk <span class="is-dark-blue-span">was een echte eye-opener!</span> Met de enthousiaste presentatiestijl en kennis van AI wist ai.nl ons te inspireren en informeren over de impact van AI op de arbeidsmarkt.


Handboek AI Strategie
Hoe zet je AI écht effectief in voor je jezelf, voor je team en voor je organisatie? Met ons Handboek AI Strategie kom je van business uitdagingen naar AI-oplossingen. Met cases van Nederlandse AI-koplopers zoals Picnic, KPN, ANWB en FrieslandCampina.


The AI Group B.V.