Stop Overthinking Scenarios and Start Measuring Them
Red Bull Racing runs eight billion simulations per race, while most businesses settle for three. Discover why data simulation beats traditional forecasting.
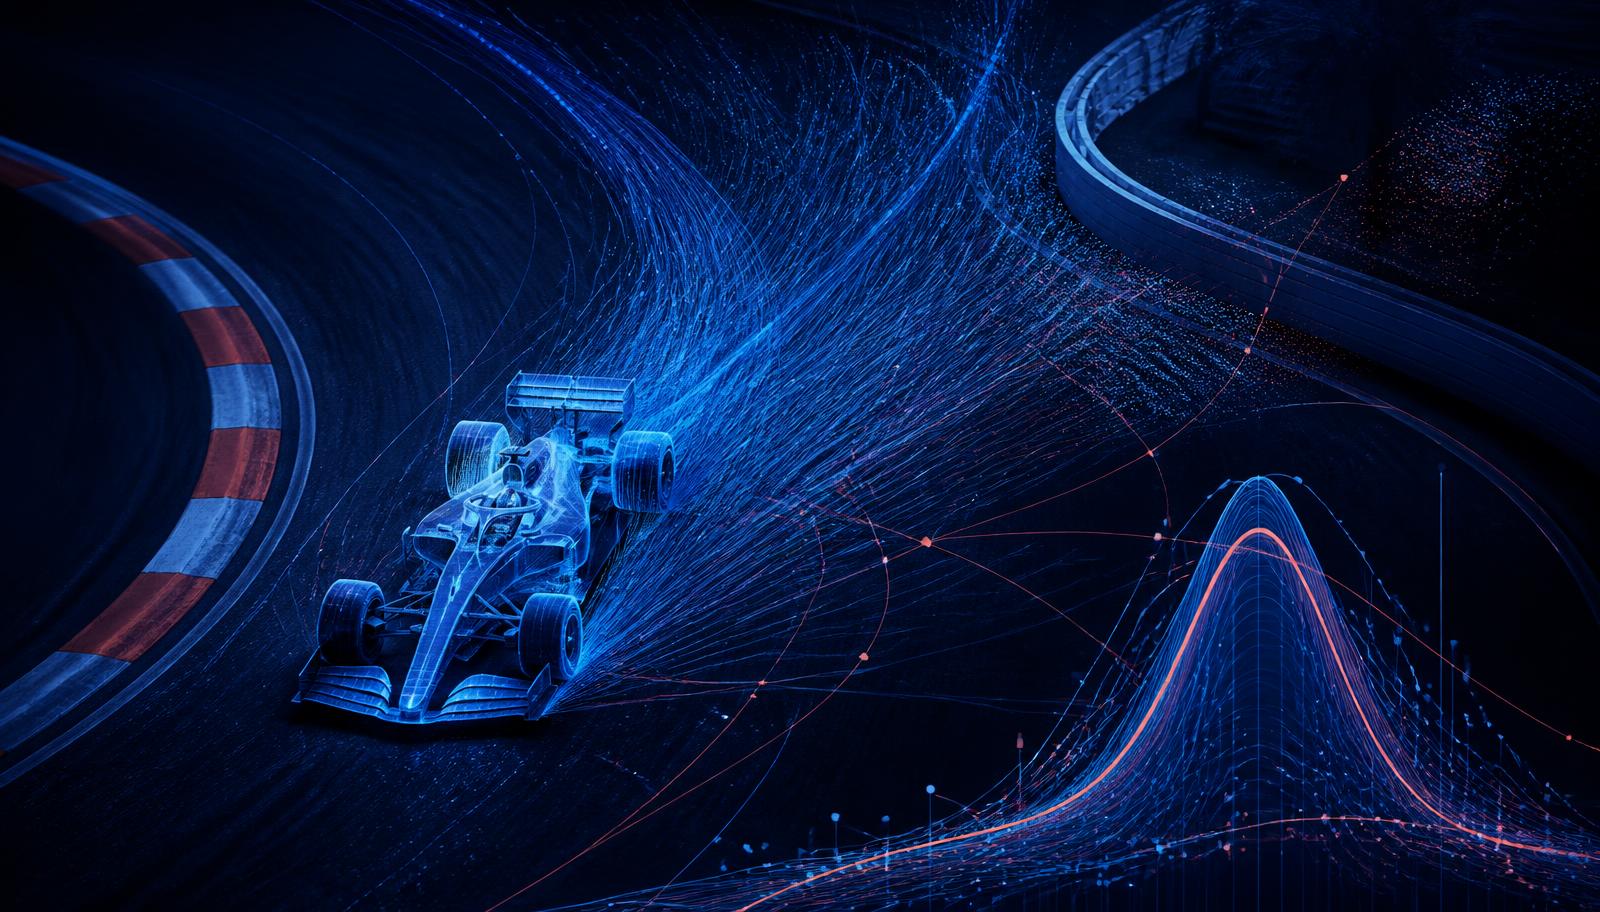
Oracle Red Bull Racing drives eight billion races that never actually take place. The Dutch corporate world makes a single forecast and buries the rest in an appendix under 'risks'. The difference isn't computing power. The difference is that one organisation measures its uncertainty, while the other just holds meetings about it.
Last Sunday, Max Verstappen ended up in the wall during the opening lap of the latest Dutch Grand Prix. At that point, his team had already calculated around four billion complete races for the weekend, with another four billion running simultaneously as the race unfolded. Not a single one saw that crash coming.
That sounds like an argument against simulation. It is exactly the opposite.
Two days earlier, I was sitting in the Oracle Red Bull Racing team motorhome opposite Martin Galpin, Head of Technology & Analysis Tools. He leads the thirty-five engineers and data scientists behind everything that sets the team apart on the track. I asked him if everything runs on software during a race. His answer began with a saying older than all the AI in the paddock: all models are wrong, but some are useful. The wind tunnel is a model. The simulator is a model. None of them captures reality completely. And then came the sentence that ultimately summarises the weekend: a human still ultimately decides when the car comes into the pits.
That is the lesson the business world ought to take away. All that compute does not reduce the number of estimations. It relocates them.
Estimations move to the edges
In an organisation without simulation, human judgement is everywhere. In the assumption, in the calculation, in the interpretation, in the decision. In an organisation that crunches the numbers seriously, judgement disappears from the middle and concentrates at both ends.
At the front end: what question do you ask, and which scenarios do you run? At the back end: which of the three plans do you choose, and at what moment?
Fraser Smith from Red Bull's technical partnerships team made this explicit when I asked him where the biggest bottleneck lies for a team like theirs. Not computing power, because the transition to the cloud solved that. Not the personnel, because they have the people. Not the data, because they have more of it than they can handle. What remains is whether you are asking the right question to get the outcome you need. They do not want to go down avenues that yield answers which are useless for decision-making.
This is exactly why an experienced human has become more valuable in such an organisation, not less. The routine work is gone. What remains is the part where judgement counts.
What the business world is currently doing
Ask any board of directors about their scenarios and you will get three. A base case, an optimistic variant, and a pessimistic one. Three stories, written down by people who all sat in the same meeting and share the same assumptions.
That is not scenario analysis. That is a forecast with two friendly neighbours.
What you want to extract from this is a different question entirely from which scenario is most likely. You want to know which decision holds up across the majority of scenarios. Which choice is robust, even if three of your five assumptions fall short. And crucially: how often do you dip below the threshold where it truly hurts, and what exactly causes it.
You do not get that answer by thinking harder. You get it by running the numbers over and over again.
The method is eighty years old
Monte Carlo simulation has nothing to do with AI and is certainly not new. Stanisław Ulam conceived it in 1946 in Los Alamos, whilst recovering from an illness and playing solitaire. He wondered how often such a game actually resolves successfully. Calculating it mathematically proved impossible, so he simply decided to play it many times and keep count. Nicholas Metropolis named the method after the casino in Monaco, where an uncle of Ulam used to gamble away his money.
Eighty years later, the method remains unchanged. What has changed, however, is the price.
Galpin described this shift astutely. For an F1 team, the budget cap has become the biggest IT problem because, no matter what you do, you want more compute and, nowadays, more tokens too. Purchasing a dedicated cluster for an in-house data centre is simply no longer an option under that cap. In the cloud, however, the exact same work is viable. An hour before the race, a massive cluster spins up, it runs throughout the race, and afterwards, it shuts down. According to him, it costs a fraction of what it would to buy all that computing power outright.
For a mid-sized Dutch company, it means the exact same thing. Something that was a major IT project with a business case and a steering committee ten years ago is now an afternoon's work and a credit card.
What you can do on Monday
Take one decision that you make every quarter. Inventory levels. Pricing. Staffing. A delivery date you promise a client.
Write down the five variables that determine that outcome. Not their absolute values, but their range. Demand lies between this and that limit. Delivery time varies like so. Downtime fluctuates between these figures.
Run it a hundred thousand times. Afterwards, do not look at the average, because you already knew that. Look at the distribution, at how often you dip below the critical threshold, and at which variable drives that outcome the hardest. The latter is usually the surprise, and it is the only one you need to take action on next week.
The prerequisite nobody mentions
Here is the caveat that underpins this entire narrative.
You will only extract something meaningful from this if your ranges are based on actual data. Red Bull has fifteen years of telemetry—every lap of every session on every circuit. If you fill in the distributions based on gut feeling, a million runs will primarily provide you with a highly confident wrong answer. Formulated more precisely than your old estimation, but equally wrong.
The first question is therefore not which model you use. The first question is for which decision you have enough historical data available to do this fairly. In most organisations, there are three or four of these, and that is precisely enough to get started.
Galpin also shared a second boundary with me. The number of simulations you need is determined by convergence—the point at which your outcomes become stable. Run too few, and the answer you get might not be the most probable one, simply because you have not simulated the most probable one yet. Eight billion is therefore not boasting. It is the point at which you can trust what comes out.
Back to lap one
That crash at Zandvoort refutes none of this. It confirms exactly what simulation is for.
The value of eight billion simulated races does not lie in predicting an average Sunday. It lies in the tail end. In the safety car on lap sixteen, the rain from lap thirty, the red flag that turns tyre strategy upside down. Lando Norris did not win that race with the base scenario, but because his team knew exactly what to do the moment an unexpected interruption occurred.
So, stop investing in models that predict your average day. You already know your average day. Invest in the tail end, because that is where your entire return on investment lies, and right now, you are standing there empty-handed.
And do not be fooled into thinking that AI will take over estimations. All that computing power simply relocates them, from the middle to the edges. What you are left with is the question you ask and the decision you finalise. Those remain human endeavours, and both have become significantly harder.
// About the author
Remy Gieling
Mede-oprichter, AI-expert & bestseller-auteur
Tech-expert (1988) gespecialiseerd in kunstmatige intelligentie en mede-oprichter van ai.nl, The Automation Group, Proxies en eBrain.ai. Oud-hoofdredacteur van diverse zakenmerken en daardoor een geoefend verteller op het podium en in de media. Verzorgt jaarlijks 150+ AI-keynotes in binnen- en buitenland en is gastdocent aan Nyenrode. Co-auteur van zeven boeken, waaronder 'Handboek AI Strategie' en 'AI Agents', en bekend als presentator op radio en RTL Z. Reist langs de labs van OpenAI, Nvidia en Tencent en vertaalt de nieuwste doorbraken naar inzichten die leiders direct kunnen toepassen.
LinkedIn